
Author
While the nation has been transfixed by the rapidly shifting political scene in the runup to November’s Presidential election, as well as by the spectacle of the Paris Olympics, a sudden chill has hit global equity markets. The United States saw a sharp selloff in the second half of July with the S&P 500 off 8.5% from its peak as of August 2nd, while the Nasdaq composite is off a full 13.1% at the time of this writing. Mind you, equity prices are still 14% and 16% higher than they were one year earlier, and miles higher than they were in 2019—but don’t let context get in the way of a good panic. Global markets are responding (Asian markets in particular have taken a steep dive) all because of the flawed notion that the U.S. economy may be slowing, and perhaps even entering into a recession. [1]
What’s the source of all the pessimism? Markets are being spooked by the rise in the U.S. unemployment rate along with what has been characterized as a “slowing” of payroll job growth. While there is little doubt that something very odd is happening in our labor markets, in Beacon Economics’ view, characterizing these trends as a dramatic sign that the nation may be entering a downturn is completely wrong. Rather, we believe the increase in the unemployment rate is being driven by a sharp rise in the number of new workers in the U.S. labor force—one that is not being fully seen in the official data because Census population estimates have yet to account for the surge in immigration over the last two years. While this may be causing some labor market softness in the short run, in a nation whose biggest economic obstacle is a shortage of workers, this should be welcome news.
Before getting into the complexities of the labor force statistics, let’s quickly dispense with the idea that payroll job growth has slowed sharply. The only issue with the July payroll number was that it came in below expectations—114,000 new jobs instead of the Wall Street forecast of 175,000 jobs. But one month does not constitute a trend. Between 2015 and 2019, the U.S. economy averaged a net growth in payroll jobs of about 190,000 per month. Over that period, an average 1 out of 5 months saw growth of less than 114,000 jobs per month. This year, the nation has averaged 193,000 new jobs per month with one weak reading—in July. This is standard jobs-market month-to-month volatility, no more. Nor is there any evidence that there has been any substantial diminishment in the demand for workers. The U.S. job openings rate was 4.9% in May and June, below the 7% peak rate seen in the over-heated post-pandemic stimulus rush, but still higher than at any point prior to the pandemic.
That said, what’s happening with the U.S. unemployment rate? It has risen by about one percentage point over the past year, reaching 4.3% as of July. This isn’t a high rate for unemployment, but the level is not as important as the trend and a look at the historic pattern of the unemployment rate shows that the only time the nation has seen this large of an increase is in the context of a recession—certainly an ominous sign. [2] Yet, as Beacon Economics has pointed out many times in the past, one indicator does not a recession make, a lesson made clear by all the forecasters who wrongly predicted a recession in 2023 on the sole basis of the inverted yield curve. [3]

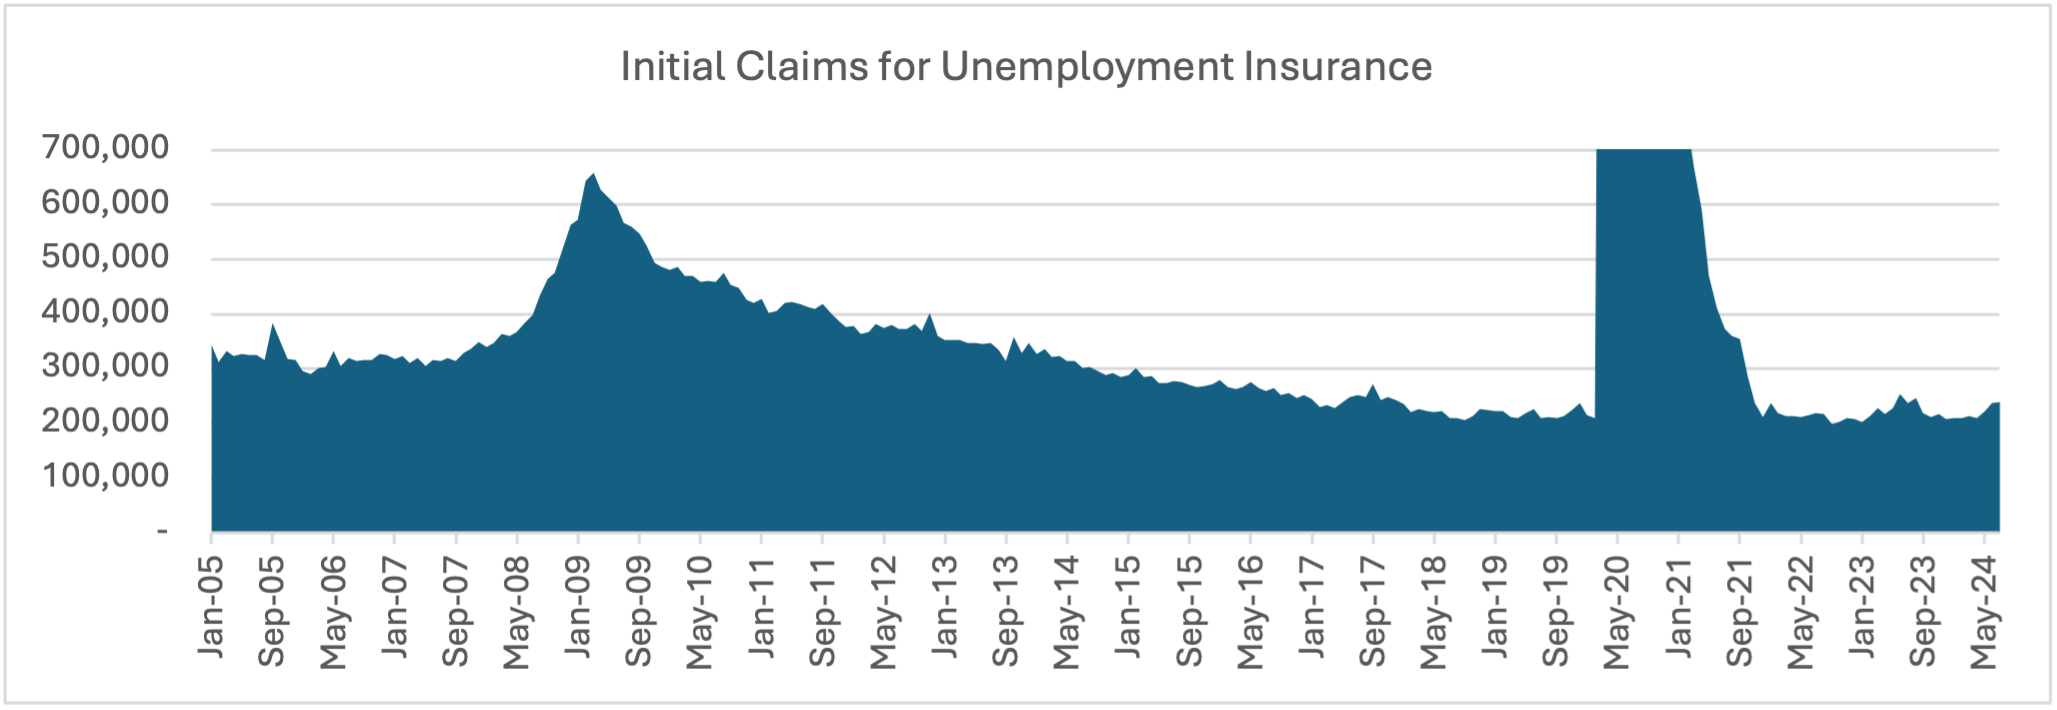
The issue this time is simple: the unemployment rate is a lagging indicator, not a leading one; it doesn’t say anything about where the economy is going, only where it came from. The past increases in the unemployment rate occurred when the economy was already in a recession, something that in no way applies to the current moment given that real GDP growth in the second quarter came in at a very solid 2.8%, industrial production is strong, real estate markets are gaining momentum despite high mortgage rates, and the debt markets remain clean. Moreover, while the rate of unemployment has risen, other indicators of a weakening labor market such as initial claims for unemployment insurance and data on involuntary job separations have not risen at all. Something odd is going on—but it isn’t a weakening U.S. economy.

The real mystery is the data mismatch between the household and payroll figures. In the last six months the U.S. economy has added 1.15 million people to its labor force. At the same time, household employment has only risen by 100,000—which is why unemployment has grown by roughly 1,000,000 workers, driving the increase in the unemployment rate. But how can it be that payroll employment has grown by 1.16 million over this period? The payroll numbers have grown substantially faster than the household numbers; and not just in the last six months, but over the past two years. During the last two years the payroll numbers have increased by 5.7 million, whereas the household employment figures have only grown by 3 million, and the overall labor force by 4.4 million.
Change in U.S. Employment Levels
Based on July 2024 data
|
6 Month Change |
24 Month Change |
|
|
Labor Force |
1,153,000 |
4,364,000 |
|
Household Employment |
114,000 |
2,984,000 |
|
Household Self-Employed |
57,000 |
80,000 |
|
Multiple Job Holders |
201,000 |
834,000 |
|
Payroll Employment |
1,163,000 |
5,685,000 |
|
Payroll / Household Job “Gap” |
905,000 |
1,947,000 |
To start unravelling this conundrum, it is important to note that household employment and payroll employment data are compiled in completely different ways (and note that the numbers will be updated when they can be). The payroll surveys are loosely based on W-2 records, whereas the household numbers come from the monthly U.S. Census Current Population Survey of Households. In other words, one set of data comes from employers while the other set comes from workers. If someone is self-employed they will show up in the household data, but not in the payroll numbers. On the other hand, if a worker holds two payroll jobs, they will be double counted in the payroll data, but only show up once in the household numbers. In the United States, there are more self-employed people than there are multiple job holders, so household employment is always larger than payroll employment.
While the statistics vary in terms of their construction, they tend to move closely together. For example, from December 2014 to December 2019 the household survey grew by 11.2 million workers, whereas the payroll number grew by 11.4 million. That correlation appears to have completely broken down over the last couple of years. Some of this can be explained by the 834,000 people who have reported picking up a second job, but that still leaves over 2 million payroll jobs filled by ‘mystery’ workers. According to the household survey figures the number of self-employed workers has remained steady, so this gap cannot be explained by a movement of the self-employed into formal W-2 employment.
Given that the payroll numbers are based on accounting records, we rely on them to be a better estimate. The problem is likely with the household figures, since those are based on a survey of just 60,000 households per month. The problem almost assuredly lies with how the Census takes this sample and expands it to a population level estimate. This is based on the Census’s current estimate of the U.S. population. The Census has a good grasp of internal demographic changes based on the American Community Survey, the decennial Census, and records of births and deaths, but it understandably struggles with a final component of population change—migration into and out of the country. The uncertainty revolves around the level of undocumented (and thus uncounted) migration into the nation.
The U.S. Census estimates that for 2022 and 2023 there was a net migration of roughly one million people per year entering the United States. This is higher than during the Trump administration, and roughly level to the latter years of the Obama administration. However, there is a growing recognition that this estimate is too low. A recent Congressional Budget Office report estimated that the actual figure for 2022 and 2023 is 3 million people per year, which is in total 4 million more than the official Census estimates.[4] If we assume that close to half of these people have entered the labor market, it would increase estimates of both the labor force and household employment by an amount that largely erases the gap between the household and payroll survey data.
Now this alone doesn’t expunge the increase in the unemployment rate—since more migrants would add to both the labor force and the number of people employed—the rate would remain unchanged or only come down slightly. But consider a situation where the U.S. economy—accustomed to absorbing one million new workers per year—suddenly experienced an influx of 2 million or more new workers per year in the midst of an economy still acclimating to higher interest rates. That would explain why the growth in household employment has not kept up with the overall labor force.
From there, concluding that the United States needs to clamp down on migrants because they are “taking” jobs from domestic workers might seem logical. But that assessment is based on the false notion that there is some fixed number of jobs in the economy over which we all compete. That isn’t how economies operate. When there are available workers, the labor market eventually expands to use them. But the timing may lag the initial surge in new workers entering the labor market. And it is worth reiterating that there has been no surge in claims for unemployment insurance or even a big decline in job openings. Workers already in the labor market are clearly not being significantly influenced by what is happening at the margins of the labor force.
The long-run reality is that the U.S. labor force has been growing at an excessively slow rate over the past 20 years, and that labor supply shortages are the single largest impediment to sustained, long-term economic growth. Immigration is a critical part of maintaining a healthy-sized workforce in the United States—something that is badly needed to help pay for the social support systems of our rapidly growing population of retired folks. And in the short run, spending by these new entrants into the U.S. economy has helped maintain today’s economic expansion. A surge in labor force growth is exactly what our nation needs right now. Of course, it would be preferable to have a functional immigration system so that those entering the economy are both appropriately vetted and accounted for in the labor force numbers. But, for years, our legislative leaders have not only failed to fix the broken process, they’ve also never truly confronted the fact that it’s broken.
In sum, the markets are being needlessly spooked. The odd dynamics of today’s labor market are not a harbinger of an economic downturn, but a sign of growing strength in the U.S. economy.
–
[1] https://apnews.com/article/stocks-markets-nikkei-economy-c6240977e9482bf7207abc53b2a11e58
[2] Indeed, if you buy into the concept of NAIRU, this is still below what a Keynesian economist would view as a stable level of unemployment. NAIRU is defined as the natural rate of unemployment, the rate of unemployment arising from all sources except fluctuations in aggregate demand. Unemployment below this level is seen to be inflationary. https://fred.stlouisfed.org/series/NROU
[3] Much of the chatter in the news is about the so-named ‘Real-time Sahm Rule Recession Indicator’, which signals the start of a recession when the three-month moving average of the national unemployment rate (U3) rises by 0.50 percentage points or more relative to the minimum of the three-month averages from the previous 12 months. I would like to suggest the ‘Thornberg Rule’, which states that the fanciness of the name relative to the simplicity of the indicator is inversely proportional to its usefulness.
[4] https://www.cbo.gov/system/files/2024-01/59697-Demographic-Outlook.pdf


