July 17 2026
Beacon Employment Report | California
Presented by Beacon Economics
Copyright © Beacon Economics LLC
Beacon Economics publishes a variety of online reports that analyze and forecast the U.S., California, and California regional economies. These publications provide users with the latest data, and with substantive commentary on the overall direction of the economy, employment and unemployment, international trade, real estate markets, consumer and business spending, and much more. The reports represent only a sampling of the kind of analysis Beacon Economics produces.
California's Unemployment Rate Falls... For The Wrong Reason
Labor Supply Contraction Continues
2,900
Monthly Job Loss
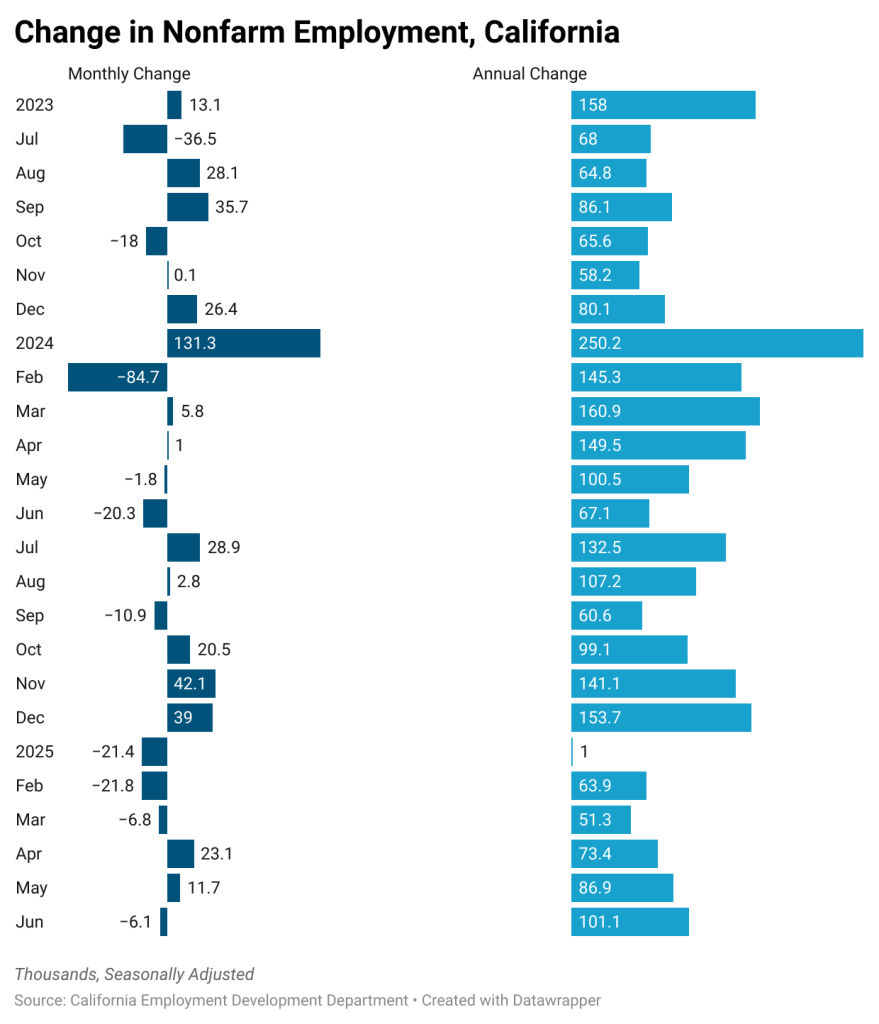
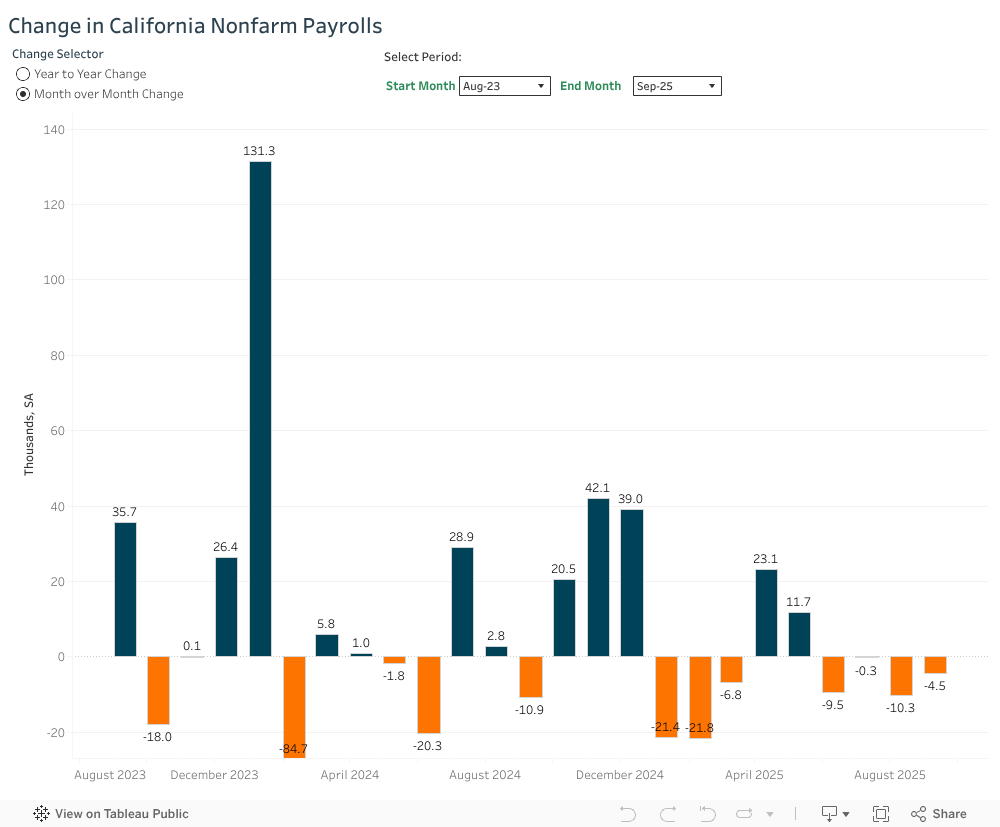
California employment decreased modestly in June, and May’s job gains were revised down.
Total nonfarm employment in the state fell to a seasonally adjusted 18,144,500 in the latest numbers (June), a monthly contraction of 2,900 positions. At the same time, May’s gains were revised down by 18,700, and as a result, the state’s overall employment numbers fell by 15,600 from April.
Longer term, California grew its payrolls by 0.6% from June 2025 to June 2026, outpacing the nation’s 0.3% increase over the same annual period.
California’s labor market continues to be supported primarily by locally serving industries such as Health Care, Education, and Leisure and Hospitality. Excluding the state’s sizeable gains in Health Care, employment levels are down 28,500 (or -0.2%) over the last year.
5.2%
Unemployment Rate
California’s unemployment rate fell to 5.2% in June, down 0.1 percentage-points from May. The state’s unemployment rate has fallen by 0.3 percentage-points over the last year, while the nation’s rate has ticked up 0.1 percentage-points.
“Normally, a declining unemployment rate would be a favorable trend,” said Justin Niakamal, Research Manager at Beacon Economics. “In California’s case, however, the decline occurred due to a broader contraction in the labor force rather than an increase in household employment.”
The state’s unemployment rate remains amongst the highest in the nation, behind only Washington D.C.
48,700
Labor Supply Decline
California’s labor supply fell by 48,700 month-over-month. Over the past year, the state’s labor force has contracted by 199,000 workers, a 1.0% decrease, and a steeper decline than the nation’s 0.6% drop. Lower levels of international migration to the United States and California’s chronic housing shortage continues to limit labor supply growth.
(If you are unable to view the graphics in the Beacon Employment Report, please check your cookie settings.)
The Beacon Employment Report | California is a unique analysis of California’s employment numbers and trends. Each month, we link our own econometric predictions to data released by the U.S. Bureau of Labor Statistics and the California Employment Development Department to identify important changes in employment across industries and regions. The Beacon Employment Report is also one of the few analyses that uses seasonally adjusted numbers, which are critical to revealing accurate trends and insights within data. The analysis is a sample of the kind of research available from Beacon Economics.
The contents of this report are based on information derived from carefully selected sources Beacon Economics believe are reasonable. We do not guarantee its accuracy or completeness and nothing presented here shall be construed to be a representation of such a guarantee.
More
Information
For information about Beacon’s practice areas, please contact:
Business Development Team at [email protected]
or 424-666-2165