California’s merchandise export trade was valued at $16.446 billion in May, according to a Beacon Economics’ analysis of the latest statistics released by the U.S. Census Bureau’s Foreign Trade Division. That represented a 4.1% increase over the $15.796 billion recorded in May 2024.
Over the same period, U.S. exports in the year’s fifth month rose at a faster 5.7% clip to $183.013 billion from $173.124. As a result, California’s share of the nation’s merchandise export trade slipped to 9.0% from 9.1% one year earlier.
Exports of California’s manufactured products in May grew by 3.3% year-over-year to $10.282 billion from $9.955 billion. Meanwhile, the state’s exports of non-manufactured commodities inched up 2.3% to $2.063 billion from $2.016 billion. Re-exports jumped by 7.2% to $4.101 billion from $3.825 billion in May 2024.
“These numbers reflect the rush in May by exporters as well as importers to move goods across borders before threatened tariffs and retaliatory tariffs further impair supply chain operations,” said Jock O’Connell, Beacon Economics’ International Trade Advisor. “Preliminary data from the nation’s major seaports indicate much lower levels of maritime trade in June.”
California Imports Decline
California accounted for more than one-seventh of all U.S. merchandise imports in May.
The U.S. Commerce Department reports that California was again the nation’s leading state-of-destination for imported goods.
Still, while the state’s 13.7% share of all U.S. merchandise imports in May was valued at $37.972 billion, that figure represented a 5.7% decline from the $40.272 billion in imported goods in May 2024.
- Manufactured imports in May dropped by 5.6% to $33.557 billion from $35.551 billion one year earlier.
- Non-manufactured imports were valued at $4.415 billion, down by 6.5% from the $4.721 billion in non-manufactured goods the state imported in May 2024.
Please note that Beacon Economics has long taken a skeptical view of the federal government’s state-of-destination statistics. The data’s fundamental shortcoming is that they capture not just goods consumed by California residents or used by California businesses but also a sizable quantity of imported merchandise that is offloaded at California ports but is bound for markets elsewhere in the country.
A CLOSER LOOK AT THE NUMBERS
As always, Beacon Economics advises against reading too much into month-to-month fluctuations in state export statistics, especially when focusing on specific commodities or destinations. Significant variations can occur due to unusual developments or exceptional one-off trades and may not be indicative of underlying trends. For that reason, Beacon Economics compares the latest three months for which data are available (i.e., March-May) with the corresponding period one year earlier. Please note that the numbers cited in this report are nominal values.
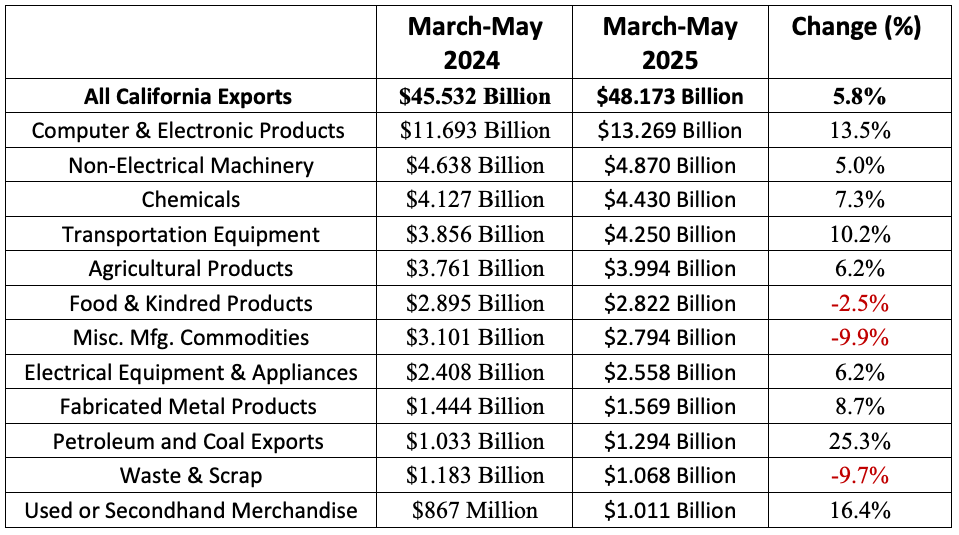
LEADING EXPORT COMMODITIES
The table below displays year-over-year changes in California’s merchandise exports. In recent years, eleven commodity groups have posted three-month export totals exceeding $1 billion. More recently, that number has grown to twelve as exports of Used or Second-hand Merchandise have topped the billion-dollar mark.
DESTINATIONS
Thirteen foreign overseas markets recorded one billion dollars or more in imports from California in the last three months. Remarkably, China was overtaken by both Japan and Taiwan in this latest list of the leading destinations of California exports.
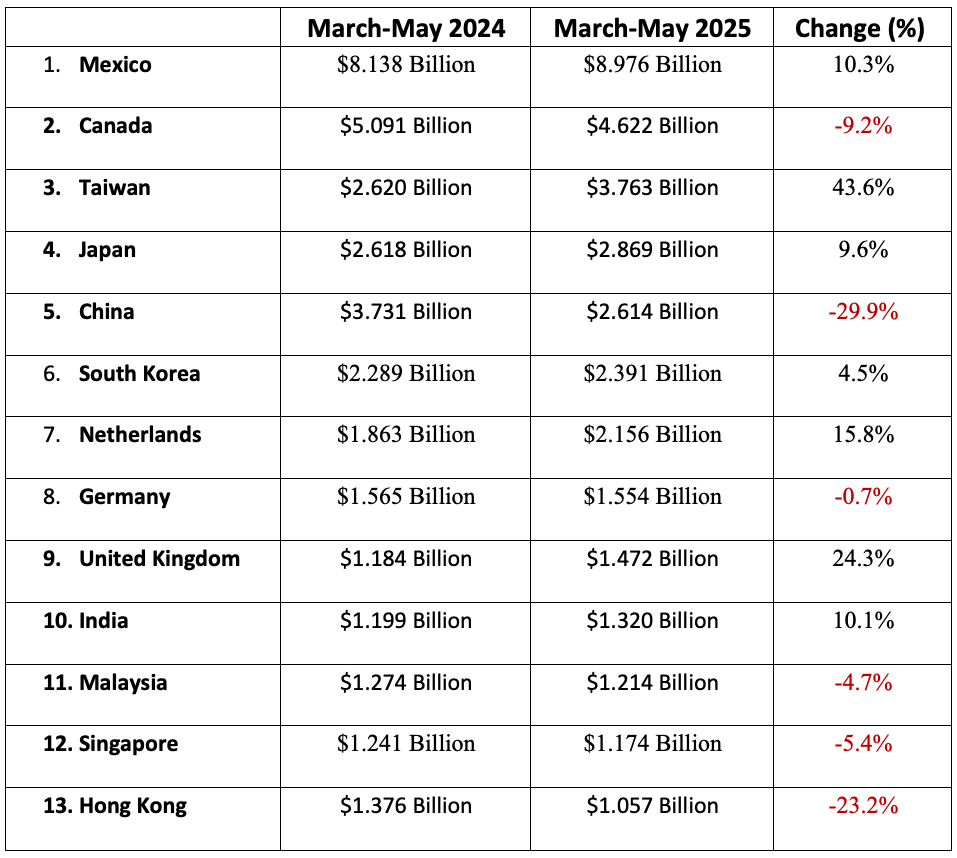
In the March-May period of this year, the state’s merchandise export trade with the economies of East Asia was essentially flat as the value of shipments across the Pacific totaled $15.564 billion, up a modest 1.1% from $15.383 billion one year earlier. Meanwhile, California’s exports to the European Union jumped by 14.6 % to $10.256 billion from $8.951 billion one year earlier. The state’s exports to Latin America and the Caribbean (excluding Mexico) surged by 22.1% to $2.568 billion from $2.104 billion. Finally, California’s shipments to the nations of Sub-Saharan Africa plummeted by 27.7% to $147 million from $204 million.
Mexico and Canada, America’s partners in the Canada-Mexico-US Free Trade Area, combined to account for28.2 % of California’s $48.173 billion merchandise export trade in the latest three-month period as the nominal value of shipments to our immediate neighbors crept up by 2.8% to $13.598 billion from $13.229 billion.
MODE OF TRANSPORT
Fully half (50.3%) of California’s $478.173 billion merchandise export trade in this year’s February-May period was shipped by air, while waterborne transport carried 24.6% of the state’s outbound trade. The balance of the state’s exports largely travelled overland to Canada and Mexico.
THE PORTS
Trade through California ports has remained stable over the last five years, however the mode by which goods are moved has shifted. Airports and Seaports continue to be the primary way by which goods are exported from California ports, but exports have declined for Seaports (-2.3%) over the last five years. In contrast, exports by land ports have grown a substantial 84.9% over this period.
Imports through California ports are up 62.2% over the last five years. Seaports continue to account for the majority of imports through California ports, however imports through California seaports have only grow 47.7% over the last five years. Imports through California Airports have doubled over the last five years.
- Total export trade for California ports for March 2025 to May 2025 was up 4.6% from the same period last year. Exports were up through Airports (22.47%) over this same period, but down at Land ports (-12.8%) and Seaports (-7.1%).
- Total import trade for California ports was up 6.1% from the same period last year. Imports were up through Airports (37.4%) over the same period, but down at Land ports (-4.5%) and Seaports (2.2%).
- California ports accounted for 10.1% of exports from the United States in May 2025, down 0.6 percentage points from the same period a year ago.
- California ports accounted for 20% of imports to the United States in May 2025, down 0.2 percentage points from the same period a year ago.
- Container counts at the Port of Long Beach grew 2.6% from May 2024 to May 2025.
- Container counts at the Port of Los Angeles grew 0.4% from May 2024 to May 2025.
THE OUTLOOK
The good news, at least for American exporters, is that the value of the dollar has plunged since the first of the year. According to the Wall Street Journal’s Dollar Index, which weighs the greenback’s standing against sixteen other currencies, the dollar is down 10.5% since January 1. While engineering a weaker dollar is not likely to be an accomplishment President Trump is apt to celebrate, it is certainly a result of the trade policies his administration has pursued.
U.S. goods are now much cheaper for foreigners to buy than at any other time in recent years. Conversely, even without the tariffs that have lately been assessed against imported goods, American importers are having to dig deeper in their pockets to buy foreign products. Normally, this should cause the U.S. trade deficit to shrink, a goal the president seems determined to seek by negotiating “reciprocal” trade agreements with the individual nations with whom U.S. firms do business. The current merchandise trade deficit, $71.5 billion, is down from the $74.5 billion deficit in May 2024. Ironically, though, the failure of a much narrower trade deficit to materialize under otherwise favorable circumstances can largely be attributed to fears that still higher tariffs may be in the offing and that rushing to stockpile goods is a sound bet.
Overall, the latest outlooks for global trade remain downbeat. The most recent McKinsey Global Survey found that the response from business executives around the world was gloomy. A growing number of respondents cited “changes to trade policy and relationships as a disruptive force they expect to affect the world economy.” McKinsey’s remarkably innocuous evaluation names no names and points no fingers, as if suggesting that Adam Smith’s Invisible Hand had suddenly been afflicted with a particularly malevolent case of palsy.
Less charitably, the World Trade Organization expects global merchandise trade to decline by 0.2% this year, featuring a 12.6% drop in exports from North America. The declines will be even steeper, the WTO warns, if trade tensions continue to roil the business world. The WTO’s Director-General describes the global trading system as “severely disrupted.”
Not all commercial activity involves transborder trade. Countries can continue to prosper even when international trade ebbs. Nonetheless, Fitch Ratings is warning that “the world economy still faces sharp slowdown induced by the most severe trade war since the 1930s.”