
There was a recent Los Angeles Times article that caught my eye. It was about a commissioned survey that asked a few thousand people from across the United States about their perceptions of California. From this survey, we learned that a large proportion of Americans think California is unaffordable, unamerican, and to boot, failing. Intriguingly, over half the survey respondents acknowledged they had never been to California or had visited just once, begging the question as to how they developed such intimate and resolute opinions about the state, its housing costs, culture, and local economy.
Of course, the obvious answer is that they’ve heard the same old clichés about California that we find repeated over and over again in the media and all around the internet. That, in turn, reminded me of one great truth about surveys that is often overlooked by consumers of such information—surveys capture human narratives, which may or may not reflect economic reality. While this may sound obvious, we need to recognize that it should change our interpretation of survey answers.
This isn’t to say that surveys are inherently useless or flawed. Quite the opposite; they are a critical tool for social scientists. While social scientists envy the physical sciences’ ability to run controlled experiments, we have surveys, a go-to tool that physical scientists can only dream about—we get to directly question the focus of our interest. Try that with a proton or bacteria! Surveys can and do play a major role in capturing information for the social sciences and comprise some of our most important data sets—including the decennial Census, the American Community Survey, and the Current Population Survey.[1]
But because surveys capture narratives that may or may not fully reflect reality, they are tricky to create, use, and interpret. This is often glossed over by those who use surveys for news value and typically is not understood by the consuming public. One example is the data on earnings and hours that come from various economic surveys such as the American Community Survey or Current Population Survey. If we believe the data at face value, it suggests that an enormous share of the U.S. labor market earns less than the minimum wage on a regular basis. When we look closer and contrast the surveys with actual payroll records, we see why this result shows up: people typically report that they work more hours than they actually do and, in turn, think they earn less money than payroll records indicate.
Some of this may be due to the fact that many workers consider their commute time to be part of their work hours, and some may fail to notice that a portion of their earnings is paid directly to the government in the form of withholdings. But there is also a reasonable case to be made that workers responding to these surveys are a bit biased in their assessment— after all, who doesn’t feel overworked and underpaid! But despite any bias, surveys still produce useful information, as long as the inherent bias is acknowledged, as well as any divergence from non-survey data. Of course, these undercurrents are rarely asserted when leveraging a survey’s results for a news story or policy argument. The surveys’ estimates of hourly earnings is often used as evidence of the need for more labor market regulation by various labor friendly groups around the nation.
That surveys elicit narratives instead of reality explains how survey results can be easily manipulated by their design and wording. Subtle shifts in cues can have a profound impact on how we recall information, which in turn will bias the narrative one way or another. Our recall is inherently limited by how our brains process memories, as Daniel Kahneman pointed out in his masterpiece Thinking Fast and Slow. Recall can be altered further by the unintentional or intentional triggering of one of our moral nodes, according to Jonathan Haidt’s book The Righteous Mind. And on top of all this, there are standard survey design issues such as sample size and choice. No wonder medical doctors find little useful information in self-reported surveys of patient behavior.
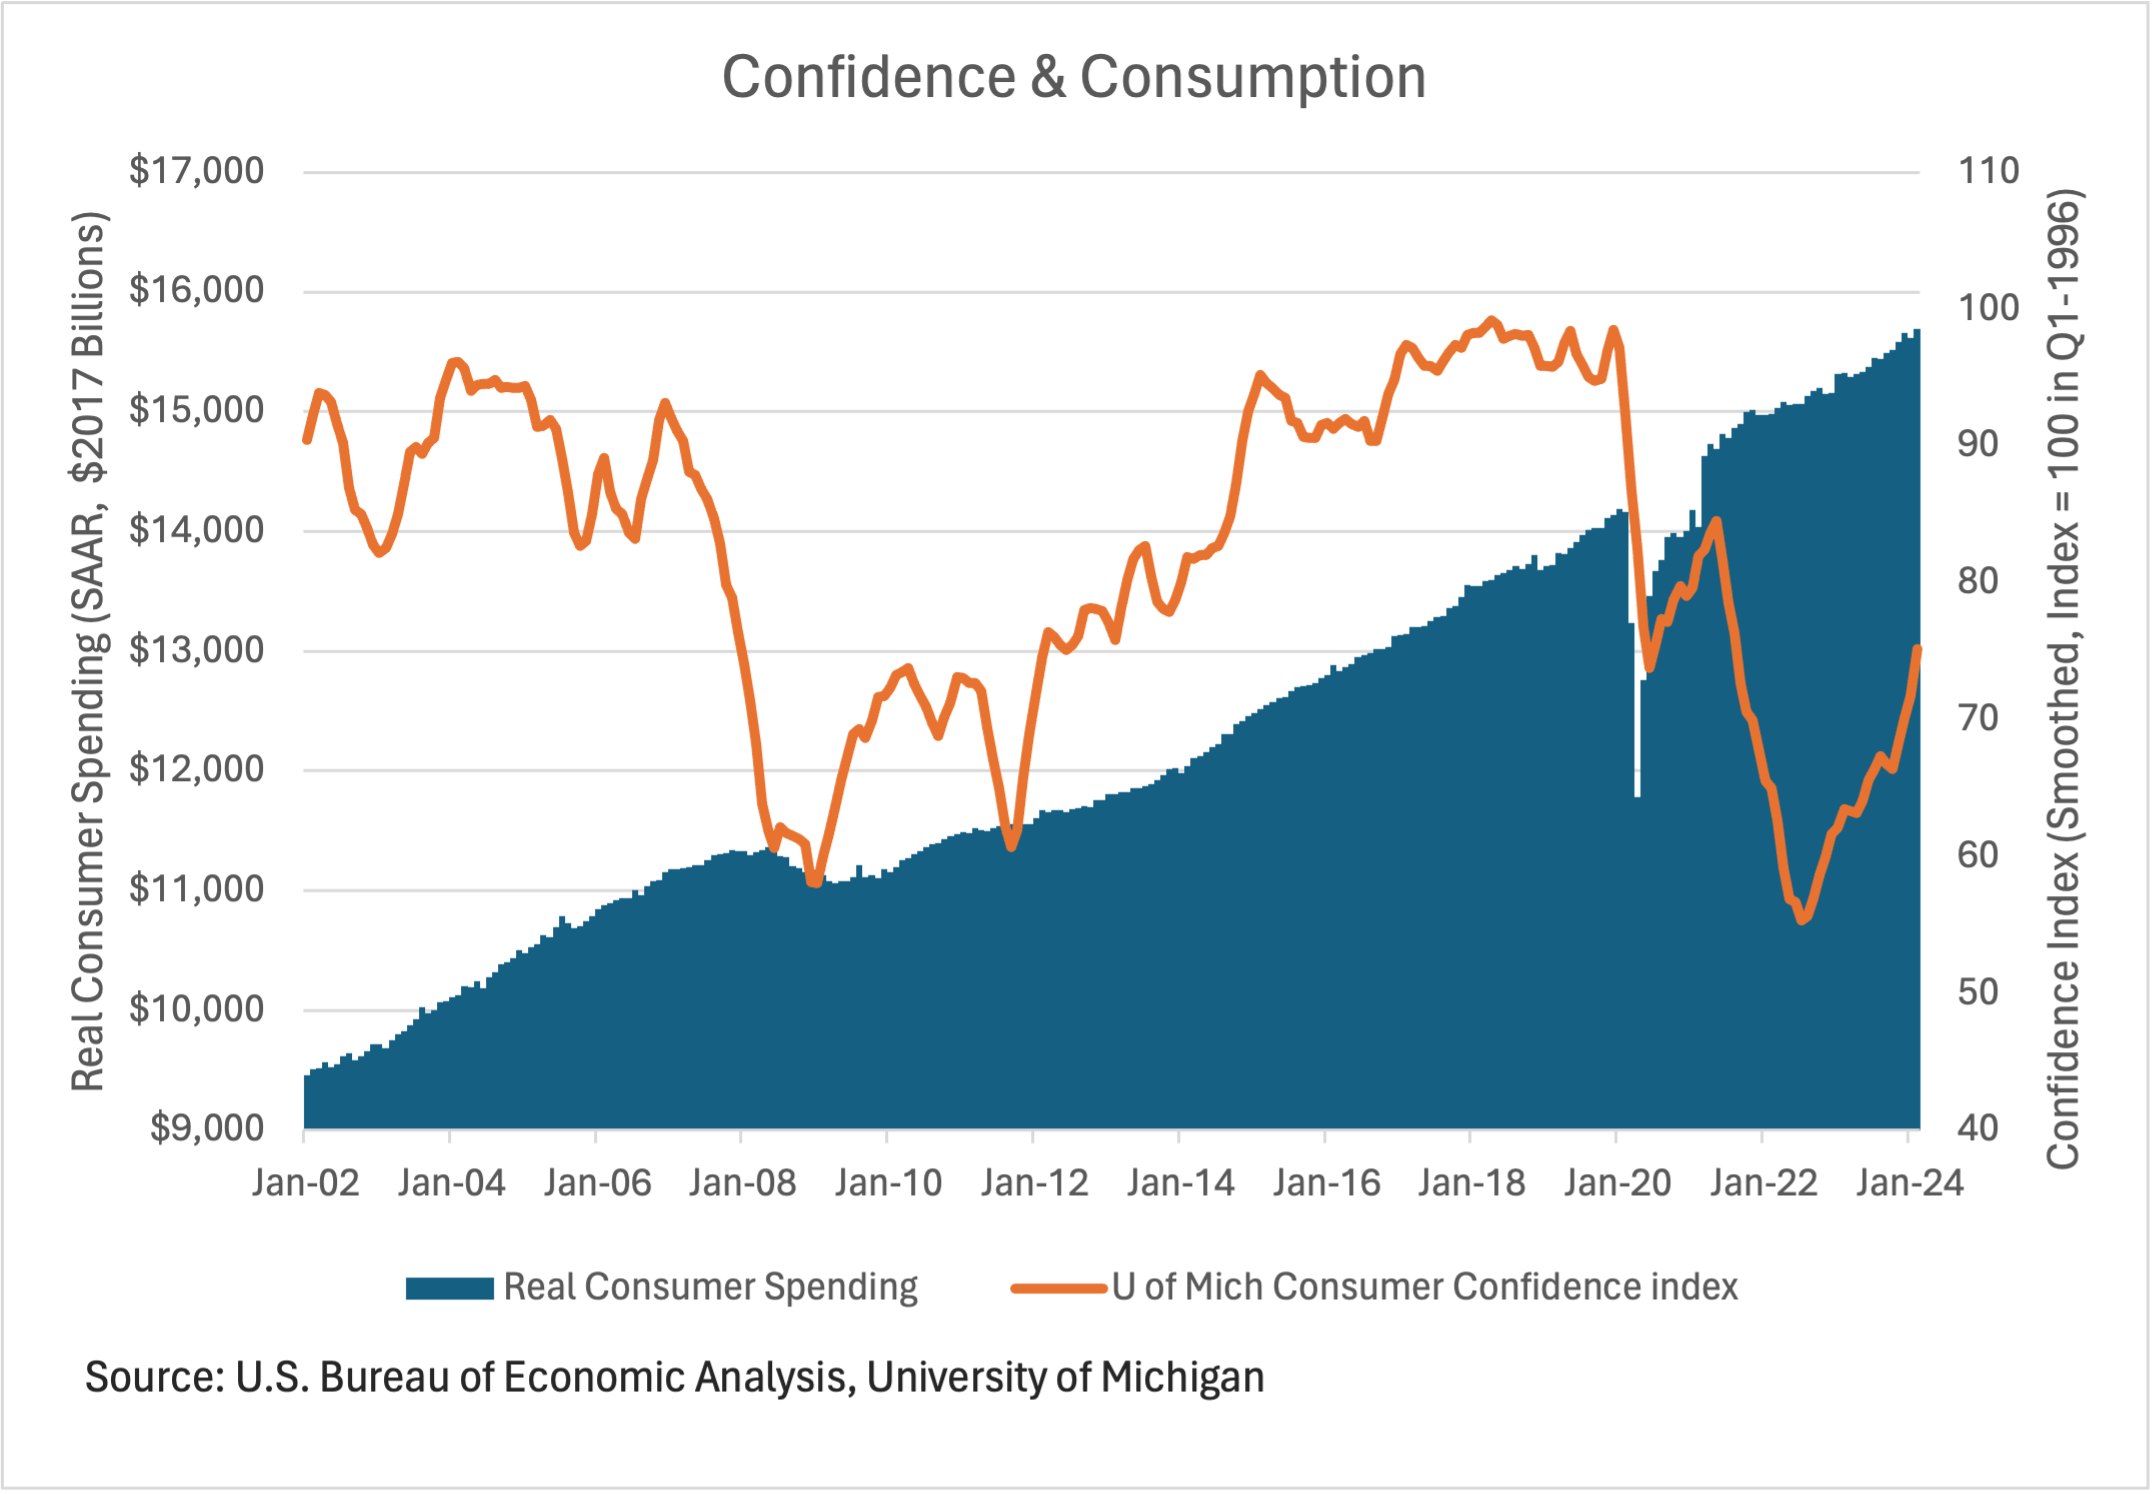
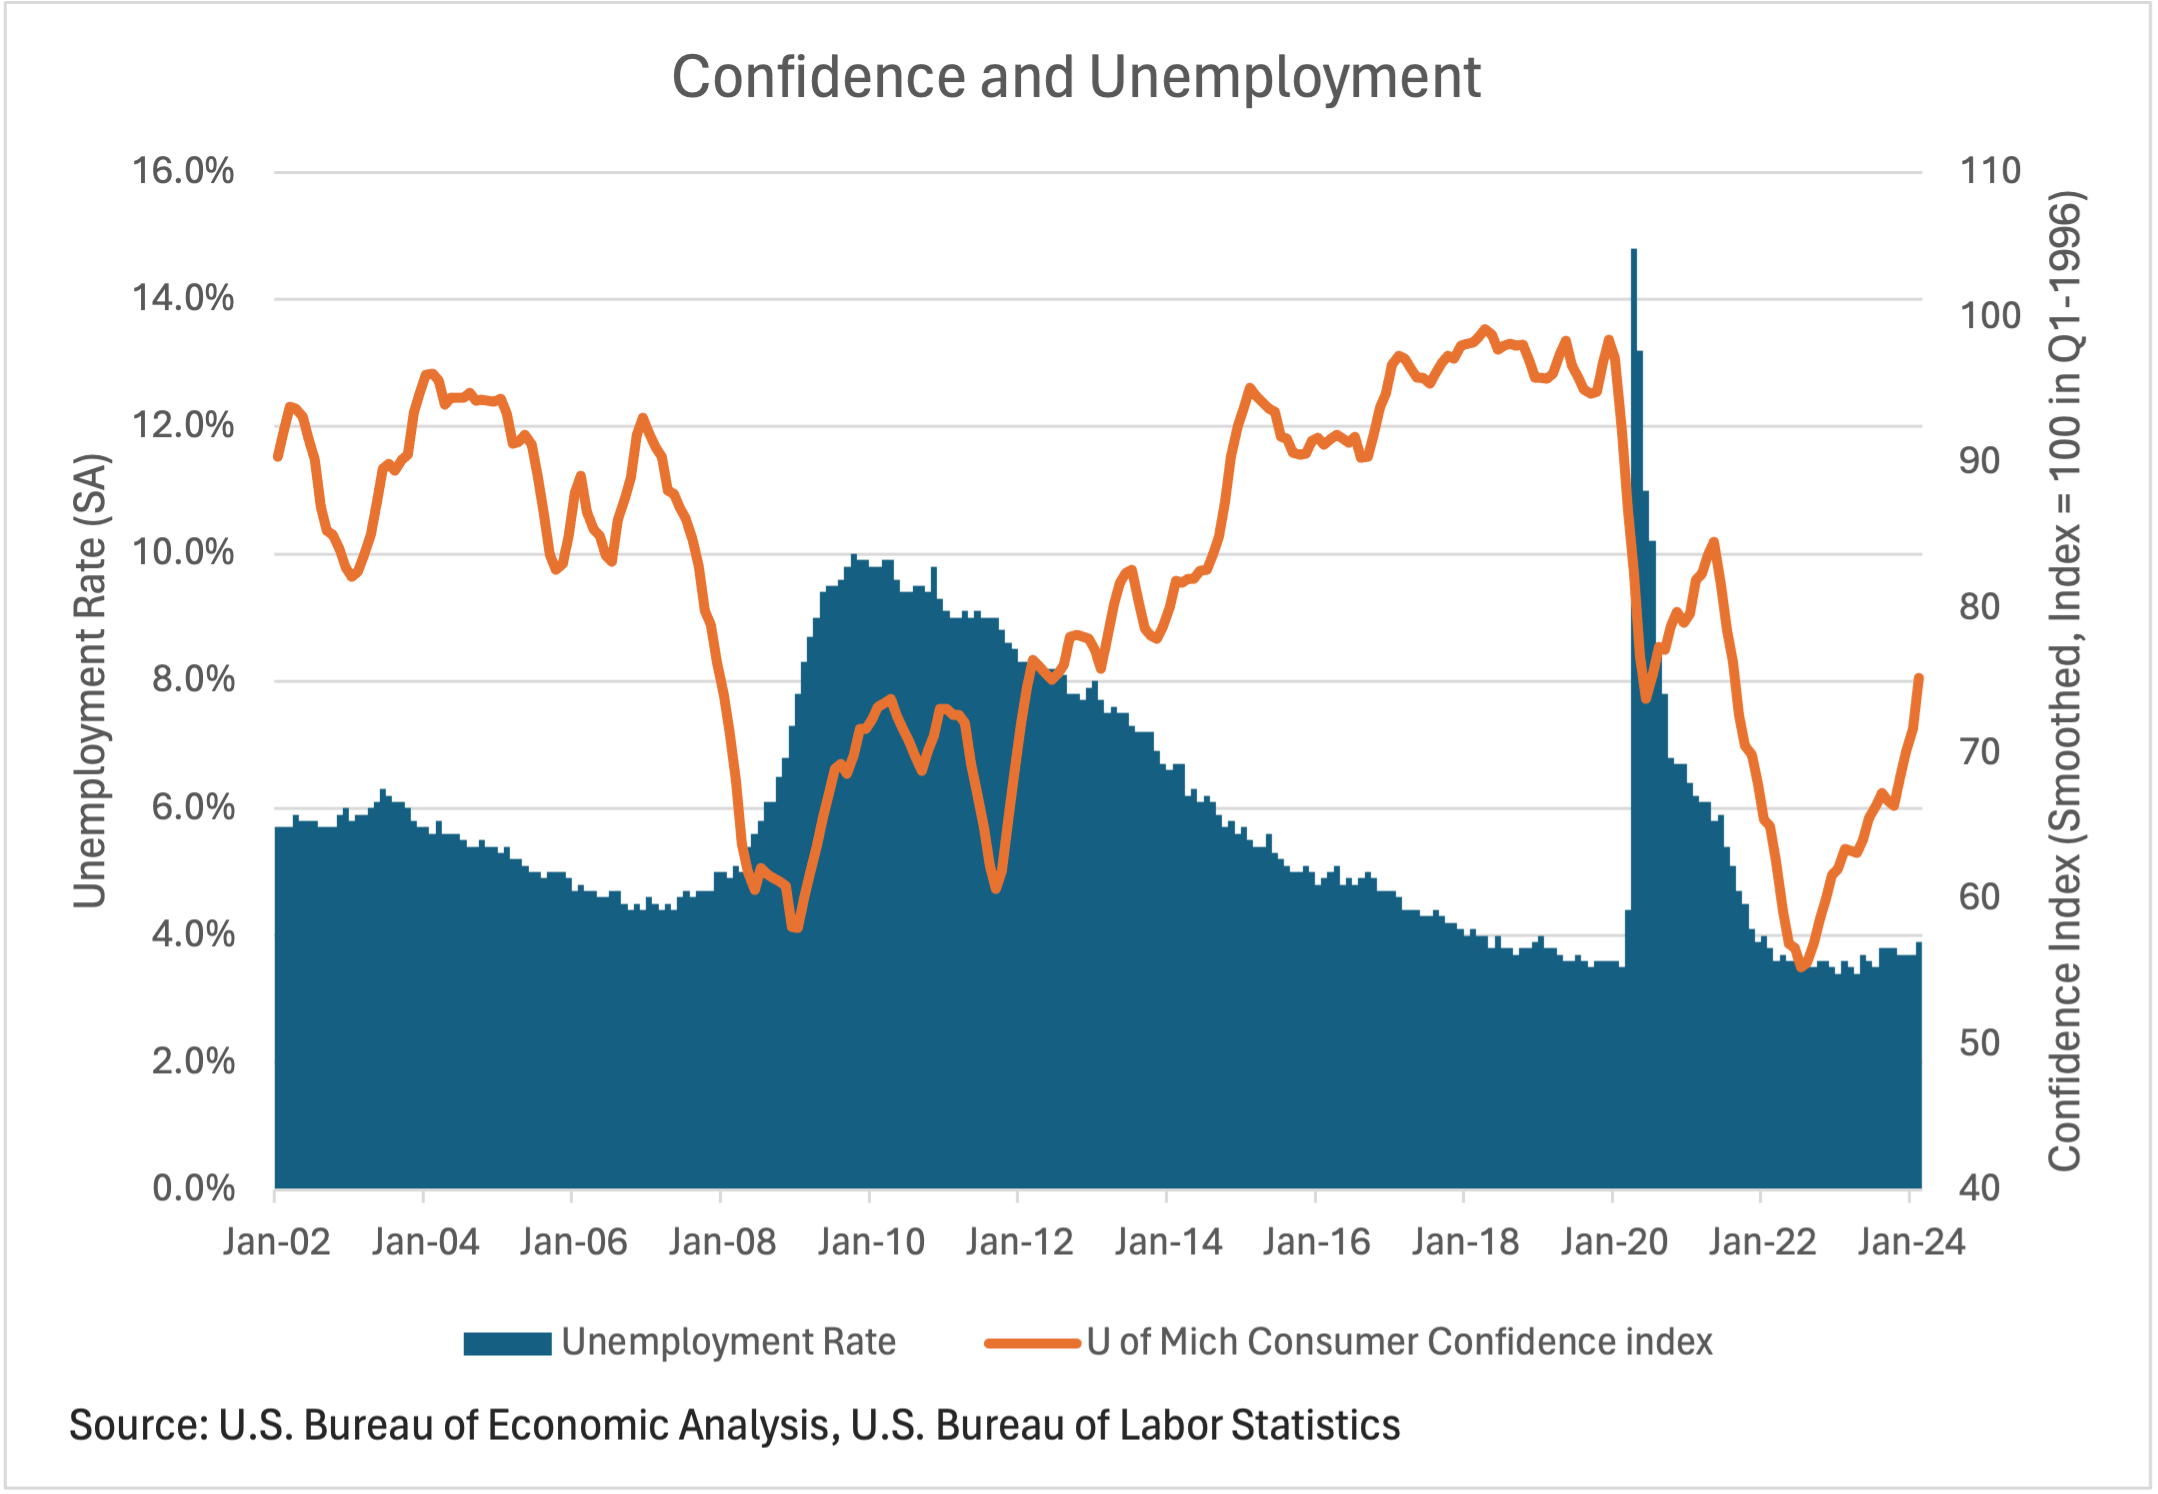
These underlying aspects of survey science help us to understand the odd dynamics in consumer sentiment surveys over the last few years. In 2022 and 2023. the University of Michigan Survey of Consumers showed U.S. consumer confidence to be the same as it was back in the middle of the ‘Great Recession’, the most severe economic downturn since the Great Depression. Yet the last two years have been remarkably different from that period of time. In the past two years the U.S. economy has been growing, unemployment remains very low, and consumer spending has been rising at a steady pace. So why is consumer sentiment so low? The answer is inflation—albeit not in the way the news would have you understand it.
The statistical regression below looks at changes in consumer confidence as it relates to the unemployment rate, growth in real consumer spending over the last year, the change in consumer prices over the last year, and the changes in prices over the previous 4 years to create a baseline expectation. Unsurprisingly, higher unemployment rates and lower levels of real consumer spending are significantly correlated with declines in the consumer sentiment index. This explains why consumer sentiment was so low in the middle of the Great Recession. But it also suggests that consumer sentiment should be much higher today than it actually is.
As it turns out, consumer sentiment is also heavily influenced by changes in price levels, even when we control for real spending trends. How powerful is the price level impact? According to the regressions, the elasticity (degree of sensitivity in economist speak) of consumer sentiment to changes in the price level is two to three times higher than it is for real consumption trends once we control for inflation expectations. In other words, we appear to care far more about unexpected changes in the prices we pay for things than we do about the change in the real quantity of things we are actually consuming. This is a sturdy result that stands out even if we change the time period of our sample or alter the functional form of the regression.
Dependent Variable: 3-Month Change Consumer Sentiment
Method: ARMA Maximum Likelihood
Sample: 1982-2024
Variable |
Coefficient |
Std. Error |
t-Statistic |
| 3 Month Change Real Consumption | 1.110 | 0.210 | 5.274 |
| 3 Month Change Prices | -2.630 | 0.723 | -3.636 |
| Price Growth Previous 4 Years | 2.750 | 1.394 | 1.973 |
| Change Unemployment | -0.642 | 0.322 | -1.995 |
| Intercept | -0.010 | 0.011 | -0.883 |
| AR Lag 1 | 0.795 | 0.037 | 21.623 |
| AR lag 2 | -0.350 | 0.040 | -8.745 |
| – | – | – | – |
| R-squared | 0.489 | – | – |
| F-statistic | 67.657 | – | – |
| Prob(F-statistic) | 0.000 | – | – |
| Durbin-Watson stat | 2.205 | — |
– |
The New Yorker recently ran a piece on the gap between narrative and reality where they discuss how Americans are stuck in a “Vibecession,” a reference to how people’s views of the current U.S. economy have lost touch with reality. While this is a fun play on words, there is nothing unique about the issue. Robert Shiller discussed this effect in an important paper written back in the 1990s, and it continues to be debated in current research about consumer behavior and expectations.[2] People feel like they are being ripped off by higher prices—despite the fact that incomes are now rising faster than prices, which is what allows real consumption to grow.
One explanation for the strong reaction to price levels comes from the psychological effect known as benchmarking. This effect explains all sorts of interesting consumer behavior, such as how our willingness to pay for something is influenced by the setting we’re in and by our expectations. For example, consumers regularly demonstrate that they are willing to pay more for a specific brand of beer from a high-end hotel then they would from a local dive bar. This holds true even if the beer will be consumed somewhere else, eliminating the idea that the willingness to pay is a function of the setting alone. Why would someone be willing to pay more for the same exact beer? It’s the power of the benchmark: we simply expect to pay more in fancy hotels. This is why high-end brands invest in expensive, visually luxurious advertising. The branding is designed to get people to set and accept a higher benchmark, which allows for higher prices and profits for the company.
Benchmarking could be one explanation for the strong reaction to inflation in recent consumer sentiment surveys. Another could simply be that it’s a feedback mechanism, whereby the survey respondent bases their response on whatever news they’ve recently heard on their favorite 24-hour news station or seen online. Unfortunately, a lot of news reporting, by definition, tends to be hyperbolic and biased to the negative. In the particular case of inflation, respondents may be invoking a fairly standard media narrative of the past couple of years, one that describes the “terrible toll” inflation is having on Americans—no matter that there is little in the data to support such a conclusion. The respondent may not even be answering on their own behalf, but rather for what they think the situation is for the “average” American.
Can we distinguish between these two explanations? It is difficult, but a couple of other data points suggest benchmarking is the more dominant source of the issue. For one, if we limit the regression sample to between 1978 and 2000, prior to the-24-hour news cycle, we still find that inflation has a bigger negative impact on sentiment than real consumption with other controls in place.
We can also see the benchmarking effect in other surveys. A great example was a survey of 2,500 Americans by L.E.K. Consulting conducted in late 2022. The results of the survey were released with the headline “85% of Americans Are Feeling Impact of Inflation in Day-to-Day Lives.” One datapoint was that 88% of the survey respondents claimed inflation had caused the respondent to cut back on restaurant spending (the italicized emphasis is meant to show that the survey’s wording was clear that answers should refer to the respondent, not the general population).
The actual data paints a much different picture. According to the U.S. Census’ Advanced Retail Sales numbers, in December 2022, restaurant spending was 13.7% higher than in the previous December, and 25.4% higher than pre-pandemic. In inflation adjusted terms, spending gained 4.3% over the year and 7.8% since prior to the pandemic. If 88% of Americans really cut back on spending at restaurants, these growth rates couldn’t have been so strong. The survey didn’t report reality, only a narrative. That narrative suggested people were upset about higher restaurant prices and maybe perceived that they had cut back, even though the spending data shows that they did not.[3]
And this brings us full circle in terms of the need to understand surveys and the role they play, or should play, in our conversations about the economy and economic policy. Consumer confidence has plummeted in the last few years despite all the objective data showing that, no matter how you slice it, the vast majority of Americans are indeed better off than they were five years ago. This indicates that the University of Michigan’s survey is not capturing reality, but capturing the consumer narrative, one that strays pretty far from reality.
What can we, as consumers of news and survey news, learn from all this? For one, always read the results of surveys with a degree of skepticism. A survey can be designed badly (sample selection, wording, ordering of questions, etc.) and even when done properly, the results often tell us respondents’ narratives, not necessarily their reality. As noted, narratives are important for understanding the economy, but when they diverge from the data-based reality, they are only helpful when contrasted against specific evidence. Always be curious and find context.
The conversation about inflation narratives versus reality also sheds light on the Federal Reserve’s policy choices. The Fed’s three major missions as a public institution are price stability, economic stability (full employment), and regulating the banking system. From a purely economic standpoint, these three missions should be more or less equally weighted. But if we think that the University of Michigan’s consumer sentiment index to be an important gauge from an economic or political perspective, then we have to recognize that price stability needs to be weighted more heavily than the other policy goals.
While recent consumer confidence surveys may not reflect reality, they are vitally important politically. From a political standpoint, we have to pay attention to how consumers are feeling. Politics chases the narrative and also drives policymaking. A false narrative can warp policy choices in dangerous and destabilizing ways. Economists do need to worry about consumer confidence because it can drive our leaders to make bad economic policy choices when it separates from reality.
There is general agreement among historians and most observers that the United States has seen political polarization spike in recent decades—an issue that has many causes. In terms of inflation intersecting with today’s politics, the biggest question is whether the decline in consumer sentiment over the last 2 years has significantly worsened our political dysfunction—or if it’s just another brick in the wall. Now that inflation has cooled and consumer sentiment is jumping, we’ll have to see if some of our inflamed political passions cool as well. Only time will tell.
[1] In contrast, payroll employment and estimates of GDP are based on various accounting data. These data are far more likely to reflect economic reality given the rules that dictate its collection and interpretation.
[2] Shiller, R. J. (1997). Why Do People Dislike Inflation? In Reducing inflation: Motivation and Strategy, pp. 13–70. University of Chicago Press.
[3] Note that the issue could be with the sample, the choice of wording, or the bias of the respondents. As noted, survey design is tricky.


