Tackling the U.S. National Debt: Pick Your Poison, America
/h2 >
The most pressing issue facing the U.S. economy is deficit spending and the growing national debt… that’s where the policy focus should be.
- Economic Policy, Economics, General Economy
- December 21, 2023
- Author: Christopher Thornberg, PhD


Christopher Thornberg, PhD
Author
Our collective worries right now seem misplaced.
We worry about oil prices, but the U.S. is the world’s top oil producer, so higher prices also mean higher domestic profits. We worry about having “too much” immigration, but birth rates are falling and immigrants support a growing workforce. And with tariffs, much of the concern has been about inflation, yet they’ve also generated meaningful federal revenue.
Meanwhile, the thing we should be paying much closer attention to—the federal budget—doesn’t get nearly the same focus. Our spending is out of line.
This isn’t to say tariffs are the solution. But they have provided some revenue at a time when the current and future U.S. deficit is becoming harder to ignore.
Tariff Worries
Before ‘Liberation Day,’ many economists worried that the new tariffs would be detrimental to the economy. That concern didn’t come out of nowhere. The U.S. has operated under relatively free trade for decades, so a major shift away from that framework was certainly going to raise concerns. And more broadly, economic theory has long pointed to the benefits of free trade. In fact, despite disagreeing on many things, economists have historically been fairly unified on this point.
The reasoning is straightforward. Free trade allows countries to focus on their comparative advantages, increasing overall production and welfare across trading partners. Of course, within each country there are winners and losers. Producers that must now compete with overseas firms are often the “losers,” as they are forced to price more competitively. The winners, by contrast, are those firms that gain access to a larger market, selling not only to domestic consumers, but also to consumers overseas. This idea runs counter to the simpler instinct or intuition that views trade as zero-sum: if you win, I must be losing. [1] But economics teaches us that there are ways to grow the overall pie… and free trade is one way to do that.
Prices and Trading Partners
So what actually happened after the tariffs were enacted? Surprisingly, not much in terms of the predicted negative effects. We haven’t seen the dramatic price spikes many feared, and overall trade volumes have remained fairly stable. The annual change in the Consumer Price Index was 2.9% in 2024 and a bit lower in 2025 at 2.6%.
That said, trade growth has slowed for real imports of goods. Imports have declined 2.7% year-over-year as of the 4th quarter of 2025. This followed a surge ahead of Liberation Day as firms rushed to bring in goods before the tariffs took effect. Since then, imports have fallen below typical levels. This could be, at least in part, a reflection of the fact that inventories are already high.
By contrast, real exports of goods don’t appear to have been significantly impacted by tariffs. Additionally, this type of movement in imports is not unprecedented. Even before the pandemic (Q4 2019), the United States experienced similar year-over-year declines in the real value of imports. Compared to the relatively extreme predictions about trade disruptions, a slowdown in import growth is far less dramatic.
What has changed, however, is the composition of our trading partners. There’s been a (continued) [2] shift away from mainland China in both exports and imports. U.S. exports to China fell to about $106 billion in 2025, down from $143 billion in 2024 (and $148 billion in 2023). Imports declined more sharply, dropping from just over $400 billion in both 2023 and 2024 to slightly above $300 billion in 2025.
TABLE
by all the forecasters who wrongly predicted a recession in 2023 on the sole basis of the inverted yield curve. [3]

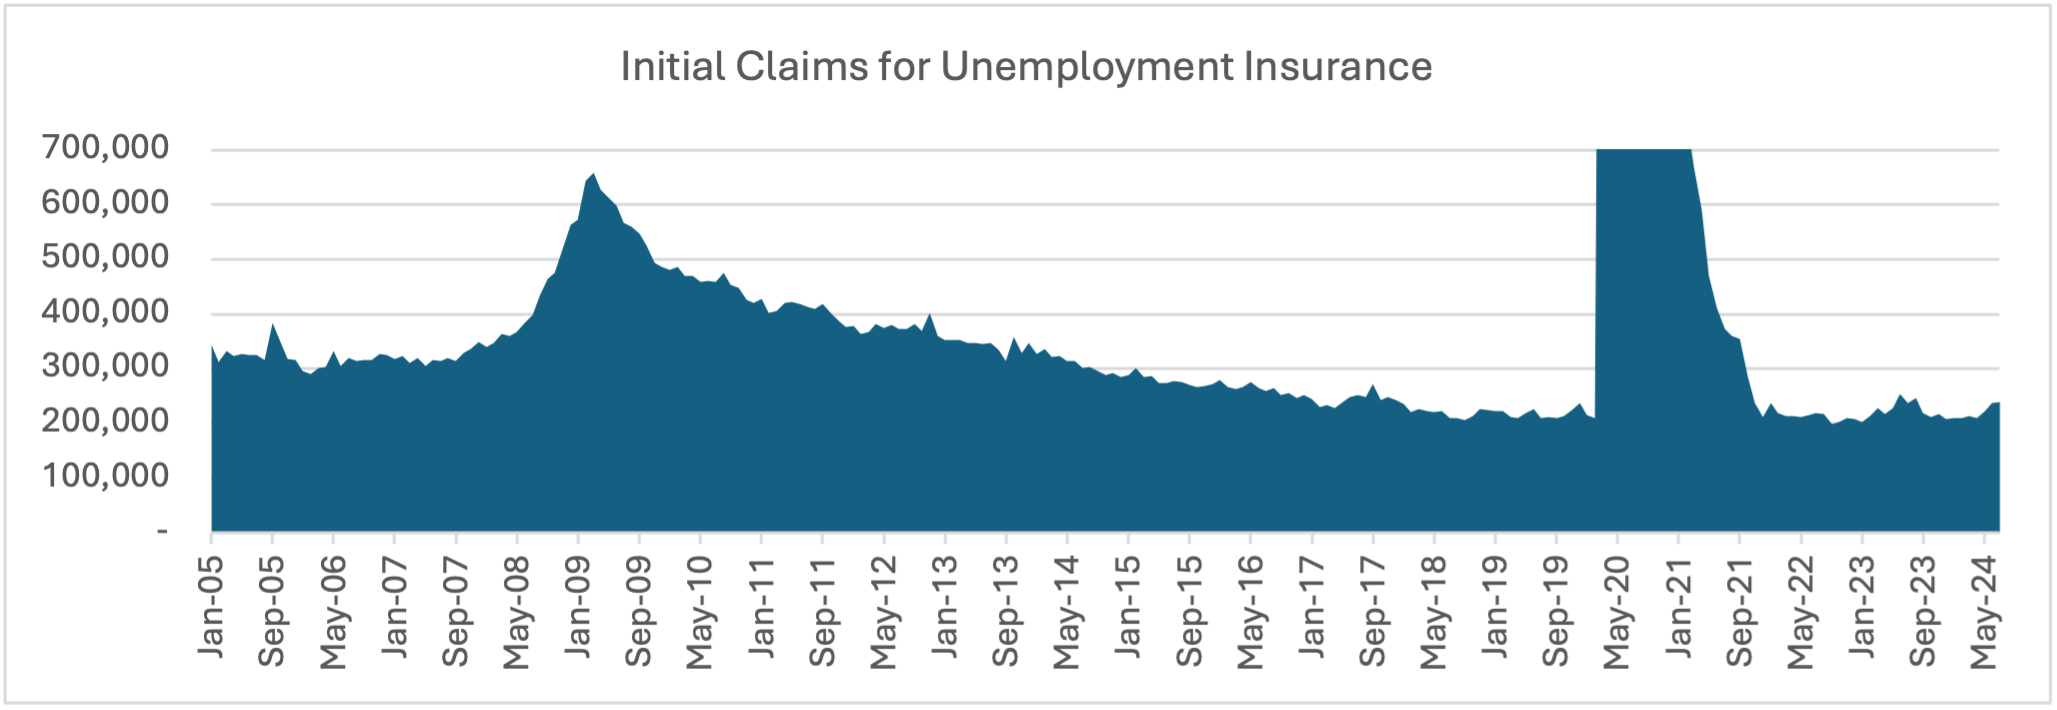
The issue this time is simple: the unemployment rate is a lagging indicator, not a leading one; it doesn’t say anything about where the economy is going, only where it came from. The past increases in the unemployment rate occurred when the economy was already in a recession, something that in no way applies to the current moment given that real GDP growth in the second quarter came in at a very solid 2.8%, industrial production is strong, real estate markets are gaining momentum despite high mortgage rates, and the debt markets remain clean. Moreover, while the rate of unemployment has risen, other indicators of a weakening labor market such as initial claims for unemployment insurance and data on involuntary job separations have not risen at all. Something odd is going on—but it isn’t a weakening U.S. economy.

The real mystery is the data mismatch between the household and payroll figures. In the last six months the U.S. economy has added 1.15 million people to its labor force. At the same time, household employment has only risen by 100,000—which is why unemployment has grown by roughly 1,000,000 workers, driving the increase in the unemployment rate. But how can it be that payroll employment has grown by 1.16 million over this period? The payroll numbers have grown substantially faster than the household numbers; and not just in the last six months, but over the past two years. During the last two years the payroll numbers have increased by 5.7 million, whereas the household employment figures have only grown by 3 million, and the overall labor force by 4.4 million.
Change in U.S. Employment Levels
Based on July 2024 data
| 6 Month Change | 24 Month Change | |
| Labor Force | 1,153,000 | 4,364,000 |
| Household Employment | 114,000 | 2,984,000 |
| Household Self-Employed | 57,000 | 80,000 |
| Multiple Job Holders | 201,000 | 834,000 |
| Payroll Employment | 1,163,000 | 5,685,000 |
| Payroll / Household Job “Gap” | 905,000 | 1,947,000 |
To start unravelling this conundrum, it is important to note that household employment and payroll employment data are compiled in completely different ways (and note that the numbers will be updated when they can be). The payroll surveys are loosely based on W-2 records, whereas the household numbers come from the monthly U.S. Census Current Population Survey of Households. In other words, one set of data comes from employers while the other set comes from workers. If someone is self-employed they will show up in the household data, but not in the payroll numbers. On the other hand, if a worker holds two payroll jobs, they will be double counted in the payroll data, but only show up once in the household numbers. In the United States, there are more self-employed people than there are multiple job holders, so household employment is always larger than payroll employment.
While the statistics vary in terms of their construction, they tend to move closely together. For example, from December 2014 to December 2019 the household survey grew by 11.2 million workers, whereas the payroll number grew by 11.4 million. That correlation appears to have completely broken down over the last couple of years. Some of this can be explained by the 834,000 people who have reported picking up a second job, but that still leaves over 2 million payroll jobs filled by ‘mystery’ workers. According to the household survey figures the number of self-employed workers has remained steady, so this gap cannot be explained by a movement of the self-employed into formal W-2 employment.
Given that the payroll numbers are based on accounting records, we rely on them to be a better estimate. The problem is likely with the household figures, since those are based on a survey of just 60,000 households per month. The problem almost assuredly lies with how the Census takes this sample and expands it to a population level estimate. This is based on the Census’s current estimate of the U.S. population. The Census has a good grasp of internal demographic changes based on the American Community Survey, the decennial Census, and records of births and deaths, but it understandably struggles with a final component of population change—migration into and out of the country. The uncertainty revolves around the level of undocumented (and thus uncounted) migration into the nation.
The U.S. Census estimates that for 2022 and 2023 there was a net migration of roughly one million people per year entering the United States. This is higher than during the Trump administration, and roughly level to the latter years of the Obama administration. However, there is a growing recognition that this estimate is too low. A recent Congressional Budget Office report estimated that the actual figure for 2022 and 2023 is 3 million people per year, which is in total 4 million more than the official Census estimates.[4] If
.[4] If
.[4] If
.[4] If
.[4] If
we assume that close to half of these people have entered the labor market, it would increase estimates of both the labor force and household employment by an amount that largely erases the gap between the household and payroll survey data.
–
[1] Meegan, D. V. (2010). Zero-sum bias: Perceived competition despite unlimited resources. Frontiers in psychology, 1, 191.
[2] This shift was already underway during the first Trump administration, as U.S.–China trade tensions escalated in 2018–2019.
[3] Much of the chatter in the news is about the so-named ‘Real-time Sahm Rule Recession Indicator’, which signals the start of a recession when the three-month moving average of the national unemployment rate (U3) rises by 0.50 percentage points or more relative to the minimum of the three-month averages from the previous 12 months. I would like to suggest the ‘Thornberg Rule’, which states that the fanciness of the name relative to the simplicity of the indicator is inversely proportional to its usefulness.
[4] https://www.cbo.gov/system/files/2024-01/59697-Demographic-Outlook.pdf
No Nonsense Economics
 See more
6 August
U.S. Labor Market Fears and the Global Equity Swoon
- See more
30 April
Surge Pricing Vs. Dynamic Pricing: What’s In A Name? As It Turns Out, A Lot!
- See more
17 April
Surveys and the Economy—What They Do and Don’t Tell Us
- See more
21 December
The Changing Patterns Of Holiday Spending
 See more
 See more
 See more
More Information
Business Development Team
at 424-372-1061 or [email protected]