Despite the many pessimistic outlooks, over the past two years the U.S. consumer has just kept on spending. Still, the markets remain worried. The Wall Street Journal’s Economic Forecasting Survey continues to suggest a 50% chance of a recession in the next 12 months—something that can only happen if the mighty American consumer finally succumbs. The markets are betting big on Fed rate cuts next year, cuts that are predicated on a slowing economy. Given all this, it’s hardly surprising that there is an intense focus on holiday spending as a sort of barometer for what the economy is likely to do in 2024.
Beacon Economics’ prediction is that we will see weak growth in holiday spending, which will seemingly confirm the slowing-economy forecast. But then—surprise!—we will see strong growth in consumer spending at the start of 2024, reversing the trend. This isn’t a difficult forecast as it is largely what happened in 2022, and again in 2021 albeit at a smaller scale. It also happened in about half of the holiday seasons over the past decade.
This pattern is not driven by short-run changes in underlying consumer demand or even random sampling errors in government data. Rather, it’s the shifting patterns in holiday spending over the long run – where the spending surge has become a small echo of its former self – and the problems that creates for statisticians who are trying to disentangle normal fluctuations in economic activity from important shifts in economic momentum. This all sounds a bit academic, but bear with me for a moment as the result is a good prediction for market fluctuations over the next few months.
The holidays, of course, are a time of higher-than-normal consumer spending. This, combined with the poor weather in the first months of each year that hampers other kinds of economic activity, implies that overall economic activity inevitably slows from the last quarter of the year to the first quarter of the following one—typically by about 3.5% in real terms. (1) This is a big decline, believe it or not, larger than most U.S. recessions from peak to trough. Yet, because such seasonal patterns occur on a regular and highly predictable basis, it doesn’t have consequences for the overall health of the economy.
But such dramatic shifts in the data create problems for those who need to understand the business cycle. The jumps can make it difficult for forecasters and policymakers to see important changes in trends that could be consequential (such as the economy tipping into a recession). This is why statisticians have developed a number of sophisticated tools to remove seasonal patterns from the data with names like X-11, X-12 and so on.
How do they work in action? Last year, when the U.S. Census reported that retail sales had fallen by 1% (seasonally adjusted) from November to December, what they really meant was that retail sales had grown by 8%, but historical patterns suggested growth should have been 9%. Hence, they reported a 1% decline. Then in January when retail sales grew by 2.5% seasonally adjusted, they actually had fallen by 16.5%, but historical patterns suggested they should have fallen by 19%, so they called it a big month for growth. All that really happened was that the actual surge in holiday spending simply wasn’t as large as expected. That could be interpreted as a sign of declining spending, which could cause the overall economy to slow; but the bounce in January showed this to be untrue. What happened was that people didn’t spend as much as expected by government statisticians. And this is the key—the holidays just aren’t what they used to be.
To get a sense of this, consider the seasonal adjustment the U.S. Census applies to December retail sales, which is the expectation of what the normal jump in spending should be, according to the seasonal adjustment process. This can be found by simply dividing the unadjusted data by the seasonally adjusted data. (2) If the result is 1.2, for example, this means the Census’s seasonal adjustment programs think that the holidays should have added 20% to growth that month. Growth below this level would show up as a decline in the seasonally adjusted data; if it were above this level, it would show as an uptick in trends.
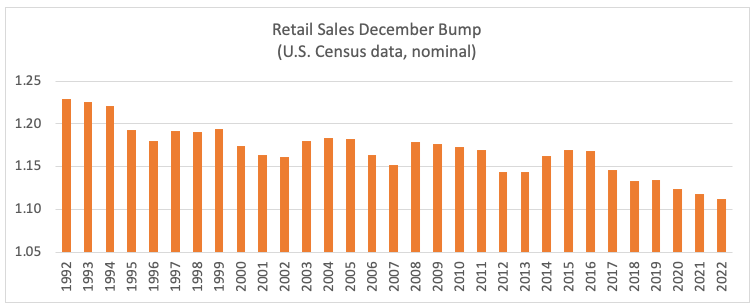
The graph above shows the expected seasonal bump anticipated by the U.S. Census’s seasonal adjustment processes for Decembers between the early 1990s and 2022. The trend is sharply downwards, implying that the standard surge in consumer spending each December has been declining over the years. Again, the holidays simply aren’t what they used to be. Back in the early 1990s the bump was roughly 22.5% for nominal retail sales in December; by the middle part of last decade that had dropped to 16.5%. Post-pandemic, the bump dropped to an all-time low of 11.3%. The seasonal adjustment program, clever as it is, has trouble keeping up with the trend, hence these regular “declines’ in the December adjusted data. (3)
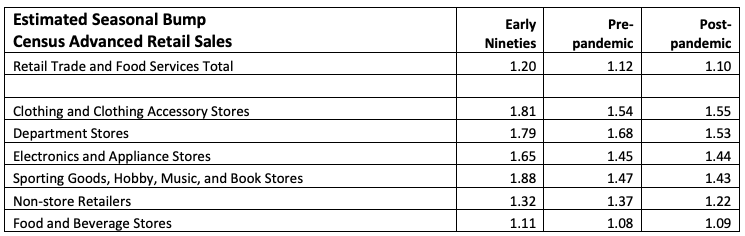
Of course, the interesting story here is the overall decline in the estimated expected seasonal sales growth, rather than the difficulty statistical programs are having approximating it. We can get a better read on the declining trends in seasonal spending growth by considering individual sectors. The following table breaks down various types of retail establishments as defined by the U.S. Census. Clothing and Department Stores have seen their December bump fall from 1.78 to 1.55, for example—there used to be a 78% increase in these sales in December, but that has dropped to 55% in recent years. Only supermarkets are seeing the same bump as in earlier times—we may not be giving as many presents, but we still like our holiday feasts!
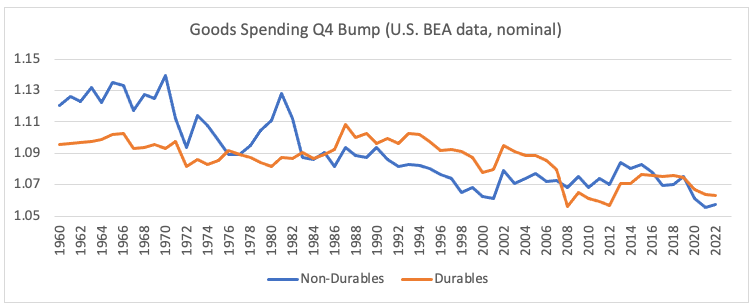
We can see a similar picture with the U.S. Bureau of Economic Analysis (BEA) data, but with the advantage of going back much further in time. This data is quarterly, which means the overall effect is diffused from looking at December alone. Again, we can see how the 4th quarter is just not what it used to be. For durables, the bump has dropped from about 10% in the last quarter of the year to 6% over the last two years. For non-durables the decline has fallen from 13% to below 5%.
What’s going on? Why are the holidays less important today than in decades past? The miserabilist interpretation of these trends is predictable: families are struggling so much with the high cost of housing and food, they can’t afford to buy gifts during the holidays (queuing up the call for higher minimum wages and rent control).
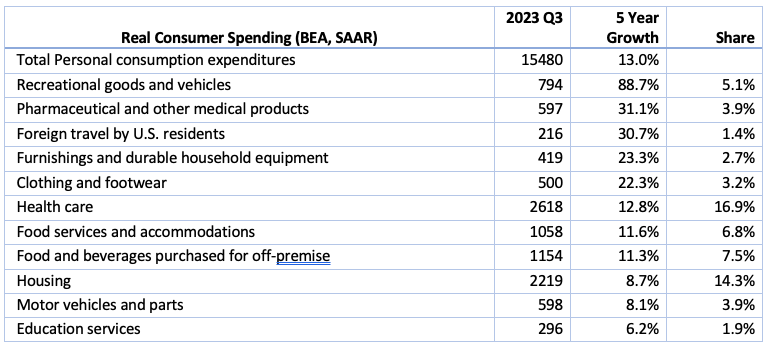
However, that viewpoint is largely contradicted by the patterns of spending growth in recent years. For example, the largest growth categories for spending over the past 5 years includes recreational goods, foreign travel, clothing, and furniture—certainly not choices for families struggling to stay housed.
What we really see here is likely a function of many things, albeit trying to unpack it all would take a lot of statistical effort. The most important factor is probably the decline in the share of children in the United States. Children were over one-third of the U.S. population in the 1960’s and are down to just a shade over one-fifth as of 2022. Similarly, is the raw decline in the number of families with children; this peaked two decades ago at 36 million and has now dropped to 33 million. Santa’s target audience is not what it used to be.
There could also be a shift in spending to other holidays. We know Halloween is becoming bigger by the year, even as Christmas seems less important. Another issue is the shift in gift giving from stuff to cash, perhaps in the form of gift cards. Those hauls may not be spent until the new year, shifting real spending to a post-holiday time frame.
We might also give a nod to what appears to be a growing narcissism among Americans. How much have we simply shifted our spending from others to ourselves? Here, we have to be cautious given that we don’t have data on gift giving, only on spending. We can note, however, that inflation adjusted trends in charitable giving shows that sort of generosity has grown very slowly over the last 20 years.
There are a number of interesting implications here. The most important may be that one month does not a trend make. The month-to-month fluctuations in economic data are a function of measurement error, seasonal adjustment programs that do a solid but incomplete job, and the fact that the economy is structurally changing over time. Yet, in the trading world, which operates as a kind of Keynsian beauty contest, this reality is unimportant, and undoubtably the market will react to such meaningless fluctuations in the official data. The standard pattern of a weak Christmas is being driven by one of these long run structural changes.
No matter what the underlying reasons for the decline in the holiday bump, it is clear that the holidays just aren’t what they once were in terms of spending. Now if only we can get our retailers to stop decorating for Christmas before Halloween!
1. This is the average decline over the past twenty years according to non-seasonally adjusted data from the BEA. The unemployment rate typically jumps 0.5% as well, another pattern erased in the seasonal adjustment process.
2. For Beacon Economics’ 2023 holiday spending forecast, we’ve considered November as well, but for all the noise about Black Friday we saw little evidence of a spending bump.
3. This gets a bit technical, but this trend line helps explains the negative news we keep hearing about holiday spending. The seasonal adjustment programs created by government statisticians are pretty clever. They have picked up on the downward trend and try to predict its path for current numbers. But these programs are not very good at picking up shifts in the trend, which is why we keep seeing weak Christmas spending bumps. The seasonal adjustment process does account for a shift in pattern trends, but the process tends to lag the actual trend, so we keep getting negative seasonally adjusted growth rates in December and then a positive one in January.
Beacon Economics specializes in delivering top down outlooks for local economies, government and industry revenues, population dynamics, and other key metrics vital to public and private sector decision making. Our forecasts are used by states, counties, cities, banks, investors, unions, nonprofits, and major industries. Learn more.


